Simulation using QX
This tutorial explains how to compile an OpenQL program and execute it on QX.
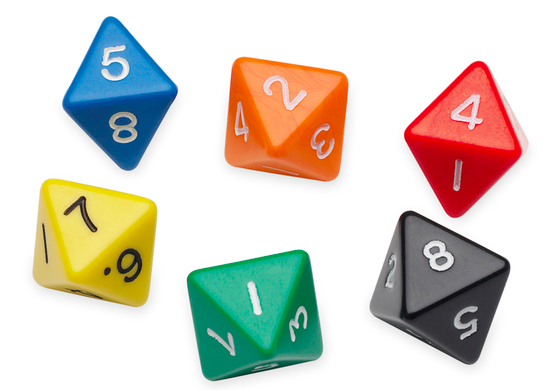
We will use the example of rolling an 8-faced dice. Rolling this dice results
in 1 out of 8 outcomes. The complete code for this example is available in
examples/dice.py. You can also copy the snippits over to your own script
as we walk through it.
We start by importing openql, qxelerator and some python packages. We also set some options for openql. For this example we will be using 3 qubits. All this is done by the following code snippet:
from openql import openql as ql
import qxelarator
from functools import reduce
import os
import matplotlib.pyplot as plt

ql.set_option('output_dir', 'output')
ql.set_option('log_level', 'LOG_INFO')

nqubits = 3
Next, we create a platform, a program and a kernel. We populate the kernel with 3 hadamard gates being applied on each qubits. This will put each qubit in superposition. Measuring each qubit will collapse the state resulting in getting either 0 or 1. This is done by dice_compile() as shown below:
def dice_compile():
    platform = ql.Platform('myPlatform', 'none')
    p = ql.Program('dice', platform, nqubits)
    k = ql.Kernel('aKernel', platform, nqubits)

    for q in range(nqubits):
        k.gate('h', [q])

    for q in range(nqubits):
        k.gate('measure', [q])

    p.add_kernel(k)
    p.compile()
Compiling the above code snippet will produce the following quantum assembly code in cQASM 1.0 format:
output/dice.qasm, the generated un-scheduled cQASM code; and
output/dice_scheduled.qasm, the generated cQASM code after scheduling.
For instance, dice.qasm contents are shown below:
version 1.0
# this file has been automatically generated by the OpenQL compiler please do not modify it manually.
qubits 3

.aKernel
    h q[0]
    h q[1]
    h q[2]
    measure q[0]
    measure q[1]
    measure q[2]
These cQASM codes can be simulated on QX simulator. For this we are using the simplified python interface to QX known as QXelarator. This is done by the following code snippet:
def dice_execute_singleshot():
    print('executing 8-face dice program on qxelarator')
    qx = qxelarator.QX()

    # set the qasm to be executed
    qx.set('output/dice.qasm')

    # execute the qasm
    qx.execute()

    # get the measurement results
    res = [int(qx.get_measurement_outcome(q)) for q in range(nqubits)]

    # convert the measurement results from 3 qubits to dice face value
    dice_face = reduce(lambda x, y: 2*x+y, res, 0) + 1
    print('Dice face : {}'.format(dice_face))
Running dice.py will produce output as shown below:
Dice face : 2
where the Dice face can be any number between 1 and 8.
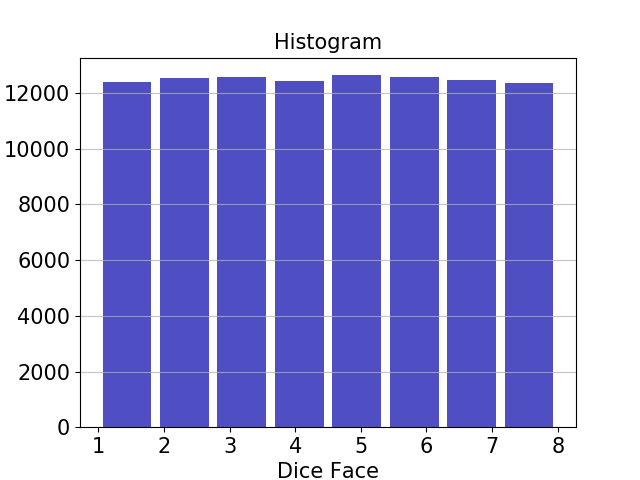
Next we can also roll the dice 100000 times and plot the frequency of occurance of each face by the following code snippet:
def plot_histogram(dice_faces):
    plt.hist(dice_faces, bins=8, color='#0504aa',alpha=0.7, rwidth=0.85)
    plt.grid(axis='y', alpha=0.75)
    plt.xlabel('Dice Face',fontsize=15)
    plt.ylabel('Frequency',fontsize=15)
    plt.xticks(fontsize=15)
    plt.yticks(fontsize=15)
    plt.ylabel('Frequency',fontsize=15)
    plt.title('Histogram',fontsize=15)
    plt.show()
    plt.savefig('hist.png')

def dice_execute_multishot():
    print('executing 8-face dice program on qxelarator')
    qx = qxelarator.QX()
    qx.set('output/dice.qasm')
    dice_faces = []
    ntests = 100
    for i in range(ntests):
        qx.execute()
        res = [int(qx.get_measurement_outcome(q)) for q in range(nqubits)]
        dice_face = reduce(lambda x, y: 2*x+y, res, 0) +1
        dice_faces.append(dice_face)

    plot_histogram(dice_faces)
This will produce the histogram similar to the one shown below: